September 29th, 2011
Key Findings
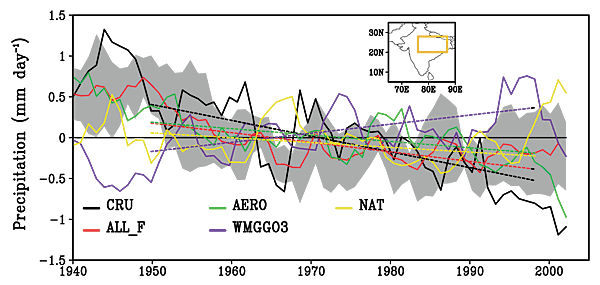
- The observed drying trend of the South Asian summer monsoon, unambiguously, is of anthropogenic origin, and can be further attributed to increased aerosols, as opposed to human-influenced greenhouse gas emissions.
- The decrease in the monsoon rainfall can be explained as an outcome of a slowdown of the tropical meridional circulation, which is driven by the need to counteract the aerosol-forced energy imbalance (including the effects of aerosol-cloud interactions) between the northern and southern hemispheres.
- The agreement among observations, theory and model simulations highlights the prominent role of aerosols in altering regional climate, and enhances our confidence in the understanding of the recent past and model projections of future climate changes.
Massimo Bollasina, Yi Ming and V. Ramaswamy. Science DOI:10.1126/science.1204994.
Summary
An important part of the global water cycle, the South Asian summer monsoon provides about 80% of the region’s annual precipitation, and touches the lives of more than 20% of the world’s population. Using the NOAA/GFDL state-of-the-art global climate model that accounts for all the known natural and anthropogenic forcings, we have investigated what caused the observed decrease in the South Asian summer monsoon rainfall over the second half of the 20th century. Was the widespread drying due to natural factors or human activities? If the latter, what were the relative contributions of anthropogenic greenhouse gases and aerosols? Answering these questions poses a challenging test on our fundamental knowledge of the changes to the Earth’s hydrological cycle, and on our ability to understand and project future regional climate change.
This work is relevant to NOAA’s mission to advance the scientific understanding of climate variability and change, particularly changes in the hydrological cycle. This is the first detection and attribution study facilitated by the latest NOAA/ GFDL global climate model “CM3”, developed over the past 5 years. The model implements an advanced treatment of aerosol physics/chemistry and aerosol-cloud interactions consistent with available knowledge, which makes it feasible to simulate the climate effects of aerosols with unprecedented realism. As CM3 is among the world’s climate models to be used in the international Coupled Model Intercomparison Project (CMIP5), and will be assessed for the Intergovernmental Panel on Climate Change Fifth Assessment Report (IPCC AR5), this work represents exciting new science made possible by NOAA’s AR5-class models.

Large-scale circulation changes caused by greenhouse gases and aerosols
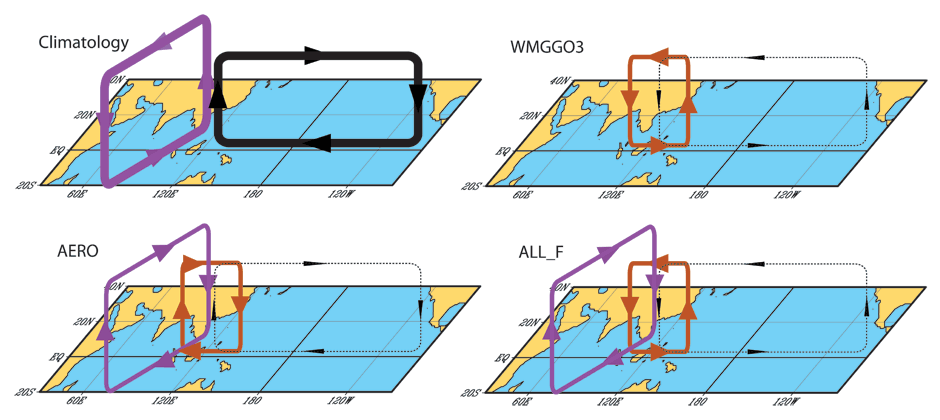
The warming caused by greenhouse gases and ozone (WMGGO3) induces a strong anomalous zonal circulation (red) between the eastern Indian Ocean (weaker ascent) and the western Pacific (stronger ascent), in addition to a modest weakening of the equatorial zonal circulation (black).
Aerosols (AERO) are responsible for an anomalous meridional circulation, which reduces the ascent over the western Pacific and Southeast Asia (purple), and opposes the local Hadley circulation. Additionally, the aerosol-induced cooling excites a strong anomalous zonal circulation (red), with stronger ascent over the eastern Indian Ocean and weaker ascent to the east, and strengthens the equatorial zonal circulation (black).
The circulation changes in the all-forcing case (ALL_F) result from the overall warming (which is predominant in the longitudinal direction along the equator) and aerosol forcing (which outweighs the warming in the latitudinal direction). The following schematic is a conceptual representation of the climatological circulation and its changes caused by different forcings.


