June 12th, 2024
Key Findings
- This study explores the extent to which the strong year-to-year variations of wind energy resources in the contiguous United States may be predictable using GFDL’s SPEAR seasonal prediction system.
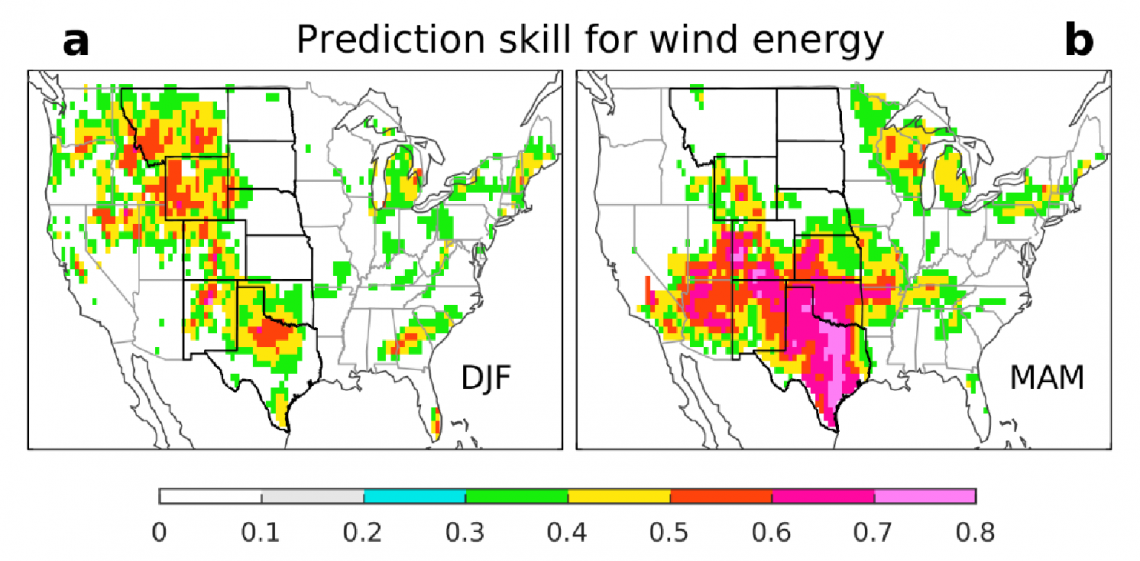
- SPEAR exhibits high skill for wind energy prediction in the peak wind energy seasons, spring and winter.
- During peak energy seasons in the southern Great Plains, which accounts for more than half the total U.S. wind electricity production, the model’s wind energy prediction can capture the strong year-to-year changes in wind energy with a high level of skill, multiple months in advance.
- An advanced predictability analysis shows that the dominant source of skillful seasonal wind energy prediction comes from year-to-year variations of El Niño-Southern Oscillation in the tropical Pacific, which alters large-scale wind patterns and storm track variations over the U.S.
Xiaosong Yang, Thomas L. Delworth, Liwei Jia, Nathaniel C. Johnson, Feiyu Lu, Colleen McHugh. Communications Earth & Environment. DOI: 10.1038/s43247-024-01457-w
This study explored the extent to which the strong year-to-year variations of wind energy resources in the contiguous United States may be predictable using GFDL’s SPEAR seasonal prediction system. The authors demonstrate SPEAR’s capability for predicting the observed strong year-to-year variations of spring wind energy resources with great skill over the Southern Great Plains, in which more than half of the total U.S. wind capacity is located. SPEAR also can provide state-level spring wind energy prediction with a correlation skill reaching 0.8 for Texas, which alone accounts for almost a quarter of the total U.S. wind capacity. These skillful seasonal wind energy predictions at the regional scale or state level can provide valuable information over the Great Plains for coping with year-to-year variations and optimizing wind energy production.
Previous studies have shown skillful seasonal predictions of wind energy several months in advance using statistical methods or dynamical models. However, research on seasonal wind energy prediction over the contiguous United States using the state-of-the-art seasonal prediction system has not been reported yet.
In this study, the authors used the seasonal retrospective forecasts from SPEAR to assess the seasonal prediction skill of wind energy resources over the Continental U.S. during 1991-2022 and ascertain the underlying physical drivers that contribute to the prediction skill using an advanced predictability analysis technique. The high skill of wind energy prediction achieved by the model occurs in wind energy peak seasons (spring and winter), and geographically collocated with the regions over the Southern Great Plains with high wind energy capacity.
With significant increases in wind energy production over the last 20 years, the electricity produced through wind power in the U.S. is on track to become comparable to electricity production from coal and nuclear sources during peak wind energy seasons. A key challenge is that winds, and thus wind power, are highly variable on seasonal to interannual time scales because of atmospheric variability. This study addresses a growing need for skillful seasonal wind energy prediction for energy system planning, production, and management.