July 10th, 2024
Key Findings
- The compounding effect of buoyancy-driven Atlantic meridional overturning circulation (AMOC) variations and wind-driven North Atlantic (NA) tripole mode mutually amplify the recent acceleration of sea level rise along the U.S. Southeast Coast (USSEC), exacerbating the role of external forcing.
- The AMOC and NA tripole mode are two important multiyear predictability sources for the sea levels.
- Using SPEAR, the sea level and its associated coastal flooding risk along the USSEC are potentially predictable on multi-year timescales.
- The authors’ forecasting system indicates that the rapid sea level rise acceleration along the USSEC is very likely to slow down in the next five years.
Liping Zhang, Thomas L. Delworth, Xiaosong Yang, Fanrong Zeng, Qinxue Gu, Shouwei Li. npj Climate and Atmospheric Science. DOI: 10.1038/s41612-024-00670-w
Sea level rise (SLR) is one of the most severe consequences of a warming climate, causing dangerous flooding and threatening lives and infrastructure in low-lying coastal regions. This study investigated the potential physical drivers responsible for the observed acceleration of SLR after 2010 along the U.S. Southeast Coast. Using observations and climate models, the authors show that the rapid increase in the rate of SLR along the Southeast Coast after 2010 is due in part to multidecadal buoyancy-driven Atlantic meridional overturning circulation (AMOC) variations, along with heat transport convergence from wind-driven ocean circulation changes.
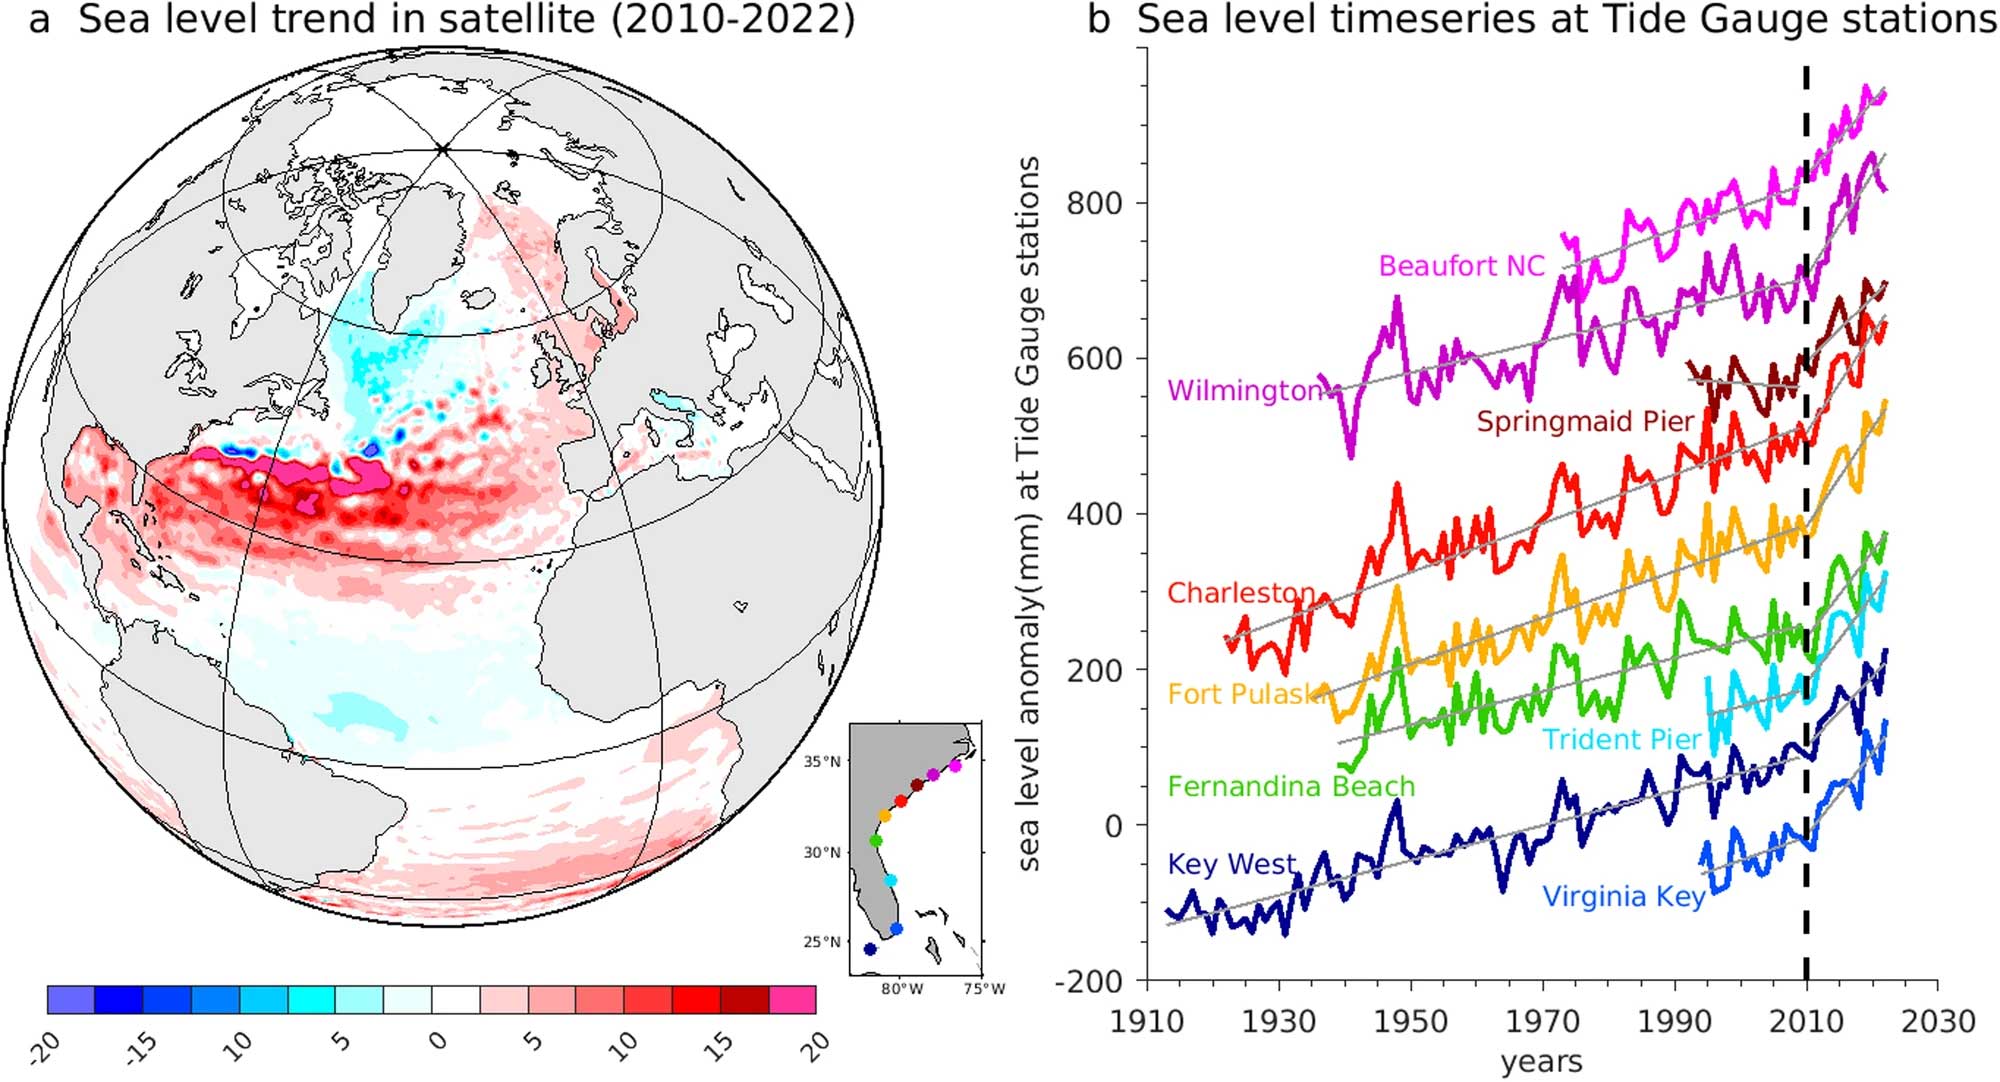
Along with coastal flooding and inundation, the occurrence of exceptionally high sea levels alters the coastal environment, moving barrier islands and cutting channels through them, impacting forests and crops, inundating the coastline with salt water, and damaging habitats essential to support wildlife. In the most recent decade, the U.S. Southeast Coast (USSEC) was identified as a “hot spot” for rapid SLR in the North Atlantic Ocean. Observations show that the linear trend of SLR along the USSEC in 2010–2022 is 3–4 times larger compared to 1920–2009. The accelerated SLR over the densely populated USSEC could elevate storm surge and exacerbate coastal flooding when it coincides with record-breaking North Atlantic hurricane seasons.
The authors explored the mechanisms and multiyear predictability of sea level along the USSEC. Reanalysis and initialized decadal predictions with GFDL’s SPEAR modeling system were used. This study showed that the accelerated SLR after 2010 represents the compounding effects of the long-term global warming trend, buoyancy-driven AMOC variations and wind-driven tripole-like response in sea level to variations in the NAO.
In addition, the authors demonstrate that SPEAR can provide skillful regional SLR predictions induced by buoyancy-driven AMOC variations 5 years in advance, while wind-driven sea level variations are predictable 2 years in advance. These results suggest that the rate of coastal SLR and its associated flooding risk along the U.S. southeastern seaboard is potentially predictable on multi-year timescales.
The forecasting system developed by the authors also indicates that the detrended sea level variability is anticipated to gradually decrease in the coming years. This reduction is attributed to a weakening of the wind-driven North Atlantic tripole mode and a slight decrease in sea level induced by the AMOC transition state. This indicates that the rapid SLR acceleration along the USSEC is very likely to slow down in the next five years.